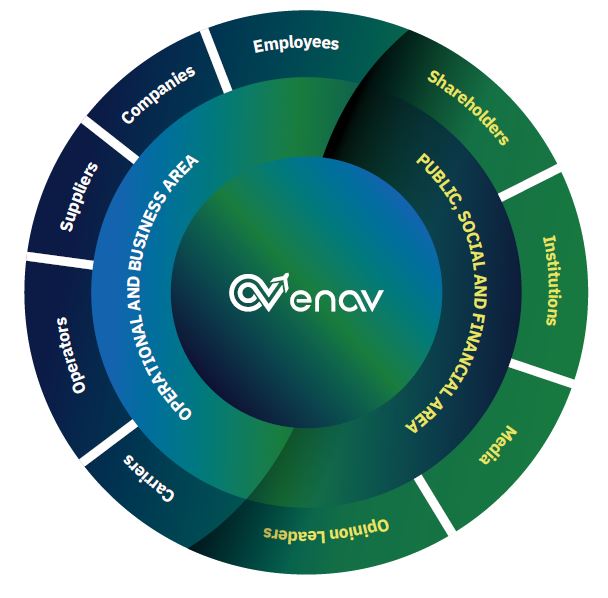
In developing our sustainability policies, listening to stakeholders is becoming an increasingly central and essential element
Interaction with shareholders, airlines, airport operators, government institutions, suppliers, employees, the media and opinion leaders is no longer aimed solely at updating our materiality analysis, but also at listening to their needs and developing new initiatives to create added value not only for us, but for the entire air traffic sector as well.

The following table provides a breakdown of the production and distribution of economic value that enables us to quantify the wealth generated by the Group and how it is distributed among our stakeholders.
| 2021 | 2022 | 2023 | |
|---|---|---|---|
| Generated economic value | 886,633 | 992,090 | 1,055,604 |
| Distributed economic value | ((732,262)) | (860,156) | (927,158) |
| Value distributed to suppliers | (140,203) | (153,645) | (157,834) |
| Value distributed to employees | (499,241) | (543,979) | (568,286) |
| Value distributed to capital providers | (65,297) | (116,680) | (148,523) |
| Value distributed to P.A. | (26,829) | (45,217) | (51,916) |
| Value distributed to the community | (692) | (635) | (599) |
| Retained economic value | 154,371 | 131,934 | 128,446 |
